Below 30% 30%-39% 40%-49% 50%-59% 60%-69% Over 70%

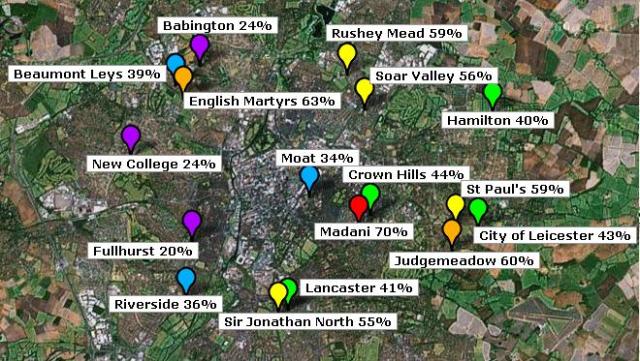
I’ve created this map to show this summer’s provisional GCSE results in Leicester’s schools. The figures represent the percentage of pupils from each school who achieved five GCSEs of at least a grade C including English and maths.
The colours make it easier to see which schools recorded the highest results, in order of the colours of the rainbow.
Head teachers emphasise that exam results alone should not be the sole factor in deciding which are “good” schools, but the map does indicate the stark challenge that education authorities have to bridge the divide in achievement between west and east Leicester.
Schools often prefer a type of measure called Contextual Value Added which shows the progress that children make between, say, the ages of 11 and 16. The CVA figures based on this summer’s GCSEs are published in January. It will be interesting then to produce a similar map to show the schools which get the best out of their students.
This map was produced in part because I’ve noticed that a lot of people have found this blog because they’re searching for schools’ exam results. If anybody has any ideas about how else to illustrate school performance, I’d be interested in hearing about them.
Click on the map itself to see it in full – and to zoom in and out. And if I find some time I’ll do the rest of the county!


Great post, thanks for doing this useful analysis.
Do post the CVA figures which, if I understand correctly, should filter out the bias caused by inherently brighter kids attending certain schools.
I think you got your purples and blues mixed up
sorry didnt look at the key…. and sang the wrong rainbow lol 🙂