Quality = Conformance to spec? Taguchi Loss Function says no!
Posted by travispower on April 3, 2009
____________________________________________________________________________________________
In my second year of school at Oregon Institute of Technology, I took a dreaded class called GD&T, Geometric Dimensioning and Tolerancing. Oh boy! My professor would often ask us if we were still awake during the class and encourage us to bring a Big Gulp with to class next time to help curb the nodding off. I never had a problem staying awake in any class, and this was no exception but it helps to illustrate the idea that this class was assumed to be very boring stuff. I figured I must be geekier than I thought, because I did not share this few. In any case I considered the message behind the class to be incredibly profound.
GD&T was all about assigning tolerances to parts so that they could be made. Up until this point in my life I had never considered the fact that if I designed a part to be 3.000 inches long the chances of it actually being manufactured at exactly 3.000 inches was for all intents and purposes zero! Not only that, but there was a difference in dimensioning it at 3.0, 3.00 or 3.000 and that difference was more and more money! This concept was revolutionary to my thinking.
Tolerancing then was about designing parts, and assigning a tolerance to each dimension so that when made, a working part would be one that fell within the allowable tolerance. With this knowledge, I proceded down the lane of quality = conformance to spec.
Conformance to Specification
Conformance to specification means that the part created by production falls within the allowable tolerances noted on the engineering drawing. These specs can be anything, for instance material type, flatness, size, color, etc. The reason why this is important is if parts aren’t created to spec, the final assembly of a product will not work. Take for instance a hole in a part, that is designed large enough to accomodate a pin. If the hole diameter is 1/2″ +/-1/8″ then the smallest hole to possible within spec is 3/8″. If the pin then is diameter 3/8″-1/16″ and the parts are created to spec, then there is no way the pin would never fit into the whole. In this way, the tolerances applied make the product work.
Inspection, is a non-value added process.
During the first quality decades in the late 50’s and 60’s, “quality” as it related to products and parts meant conformance to spec. What this created was a system where parts were produced, and then checked to make sure they fell within the applied tolerances. The idea was to catch bad parts before they went down the line, or to the customers. The problem with this thinking is that its too late. All of the time and effort had already been put into the product, and if it failed inspection it would constitute a loss of money. During this time frame, this loss was accepted so long as the good parts were the ones being shipped.
As you can imagine, this process became very costly and very difficult to execute. It was later revised to include batch inspection, where if 100,000 parts were produced, 100 would be inspected and if 5 or less of those were bad, then all 100,000 were shipped. This would constitute a less than 5% defect rate which was considered acceptable. However, that meant that 5% of the customers were getting bad parts!
Conformance to spec = High quality disbelief.
Aside from the fact that bad parts were being shipped to customers, businesses operating under the quality by inspection mantra began to view themselves as producing high quality goods if they were able to fall within a certain % defective rate. For instance, if they could get to less than 10% defective parts that was decent quality. If, however, they were able to achieve less than 3% defective parts, then this would constitute “high quality”. Just for argumentive purposes, lets say a company was able to achieve 0% defective parts through inspection against specifications; would you consider this a high quality company?
NO! The goal should not be conformance to spec, it should be to get as close as possible to the nominal dimensioned value. If a drawing has a diameter at .50″ +/- .01 the point is to get as close as possible to .50″! The best part will be .50″, and constitute “high quality” not just any part that falls within .49-.51″ window. Parts that are .49″ are in fact, low quality because they almost don’t even pass inspection. In this sense, if all the parts were made at .49″, then you would in fact have no defects but lower quality parts than if they were produced at exactly .50″. The point is, conformance to spec does not equal high quality. High quality means making parts closest to nominal as possible.
Standard Distribution of Parts
Variability is unavoidable in any process. Raw material goes through a machining step and produces parts of different measurements. There is nothing we can do about this fact. However, the old bell curve distribution often times still holds true.
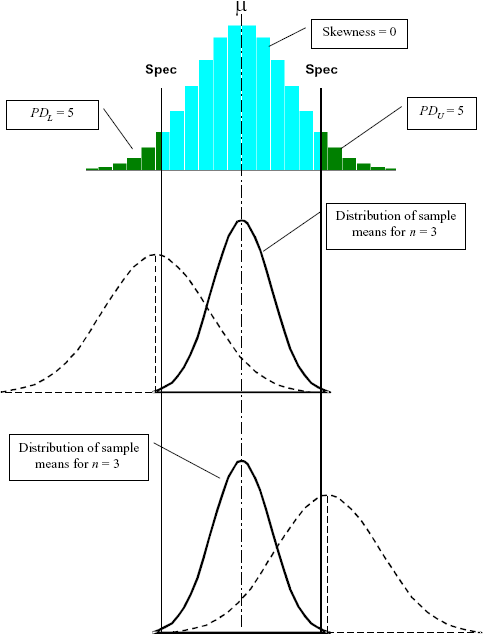
As seen in the above figure, a manufacturing process follows a bell curve distribution. Most of the parts made will be close to the same length, a length not necessarily nominal. In the first graph you can see that there will be some random parts that are made outside of spec. These parts occur less frequently than parts closer to nominal. The second graph shows a distribution that is not centered on nominal. This shift is a product of the manufacturing process. In cases like this, it would make sense to move the machines nominal in an attempt to make the part long, knowing the process will make it a little short, thus putting the bell peak around nominal.
In order to make 0 defective parts, the bell curve must fit inside the tolerances. If it isn’t possible to fit the curve within these constraints then better tooling and process is needed. This will shrink the span of the bell curve so that it can be placed inside the constraints. The third graph shows this concept. The process is modified so that the curve will be steeper and then moved towards nominal.
Taguchi Loss Function as it Relates to Quality
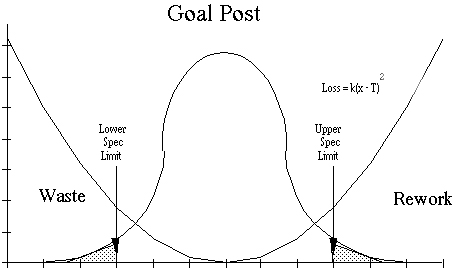
The Taguchi Loss Function was created by Dr. Genichi Taguchi, a Japanese quality expert. I Figure 2. his function is the reverse parabola. Taguchi believed that any deviation from nominal would incur a cost and this cost was proportional to the distance from nominal. If the part was created far away from nominal, the cost to rework it would be more than if it was very closer. Taguchi also went so far as to say this cost was not only a cost to the company but a cost to society.
In Figure 2. you can see that the portion of the bell curve that falls outside of the tolerance zone would incur a cost to the company in either rework or scrap. In most cases a company would not even rework oversize pieces and simply scrap them too. The Taguchi loss function drives home the idea that production should aim for nominal every time, rather than conformance to spec. You can see that there are many parts made within spec but are shown by Taguchi to be causing a loss in money to the company (or society depending on your view). This is because a part that is farther from nominal is more likely to break, and thus would incur a cost of repair.
Conclusion
Quality by inspection and conformance to specification are procedures of the past. The Taguchi Loss Function shows us that any deviation from nominal incurs a cost to society. High quality does not mean, within the tolerances stated, but rather it means the greatest amount of products produced closest to nominal. By continuous quality improvement of a production process and breakthrough techonology advancement a part distribution curve can be shrunk to conglomerate more closely to nominal. In this way a company can remove the inspection process completely and know that every part will be good.
Figure 1.) http://www.fhwa.dot.gov/pavement/pccp/pubs/04046/appf.cfm
Figure 2.) http://www.mv.com/ipusers/rm/loss.htm


Leave a comment