ChartSchool
Welcome to ChartSchool, our extensive educational resource for investors of all levels. Here you can learn everything there is to know about investing and financial chart analysis.
Browse through the articles below, or search to find exactly what you're looking for.
These articles will introduce you to the concepts, strategies and common terminology of technical analysis, as well as other financial analysis methods and important investing topics.
Overview
A diverse collection of educational investing articles
Chart Analysis
The methods used to analyze financial charts
Technical Indicators & Overlays
Descriptions and formulas for our technical indicators
Market Indicators
Descriptions and formulas for our broad market indicators
Market Analysis
Articles about the many different types of market analysis
Glossary
Helpful definitions for common financial terminology
Trading Strategies & Models
Info about technical trading strategies and systems
Index & Market Indicator Catalog
Documentation for the index symbols we provide
These articles will direct you to our helpful Support Center articles about the various charting tools and resources available on StockCharts.com.
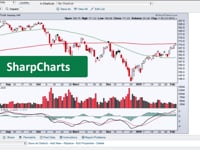
SharpCharts
Our original, award-winning financial charting tool
StockChartsACP
Our full-screen, interactive Advanced Charting Platform
ChartNotes
Learn more about our annotation tool for SharpCharts
P&F Charts Workbench
Learn how to use our Point & Figure charting tool
Interactive PerfCharts
Dynamically compare the performance of multiple symbols on one chart
CandleGlance Charts
Mini-charts displayed side-by-side to show multiple symbols at once
Seasonality Charts
Chart a security's monthly price performance trends over time
GalleryView
See a symbol in multiple time-frames all on one page
MarketCarpets
Scan large groups of securities for emerging trends and technical moves
RRG Charts
Visualize relative strength and momentum for a specific group of securities
Dynamic Yield Curve
An interactive yield curve showing the relationship between rates and stocks
These articles will help you learn more about our Advanced Scan Engine and get you started creating custom technical scans on StockCharts.com.
Technical Scans
Overview of Technical Scans
Get a sense of what you can do with technical scans on StockCharts
Advanced Scan Workbench
Create custom technical scans for your unique criteria
Scan Syntax Reference
Find helpful scan starters and snippets
Advanced Scan Library
A collection of advanced scans for you to use or start from
Scanning Tutorials
Get a sense of what you can do with technical scans on StockCharts
Technical Alerts
These resources will go beyond ChartSchool and help you continue learning about investing, technical analysis, StockCharts features and more.
StockCharts Blogs
Expert market commentary by top technical analysts
Instructional Videos
Videos to help you get the most out of StockCharts.com
The ChartWatchers Newsletter
Our free twice-monthly email newsletter
The StockCharts Store
Hundreds of top-selling investment books, DVDs and more
Public ChartLists
View charts from other StockCharts Members
StockCharts Answer Network (S.C.A.N.)
Our user-to-user help site and online network
Instructional Videos
Getting Started with StockCharts.com
Seven of the most important things all StockCharts users need to know.
SharpCharts Basics
Learn how to create SharpCharts, find symbols, change time periods, active auto refresh and more.
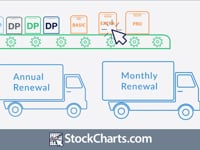
Subscribing to StockCharts.com
Learn more about our Service Levels, Data Plans, renewal cycles and pricing.
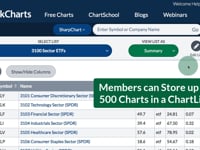
ChartLists: Introduction
An intro to ChartLists, including how to save, view, organize and manage your saved charts.